Visualize data
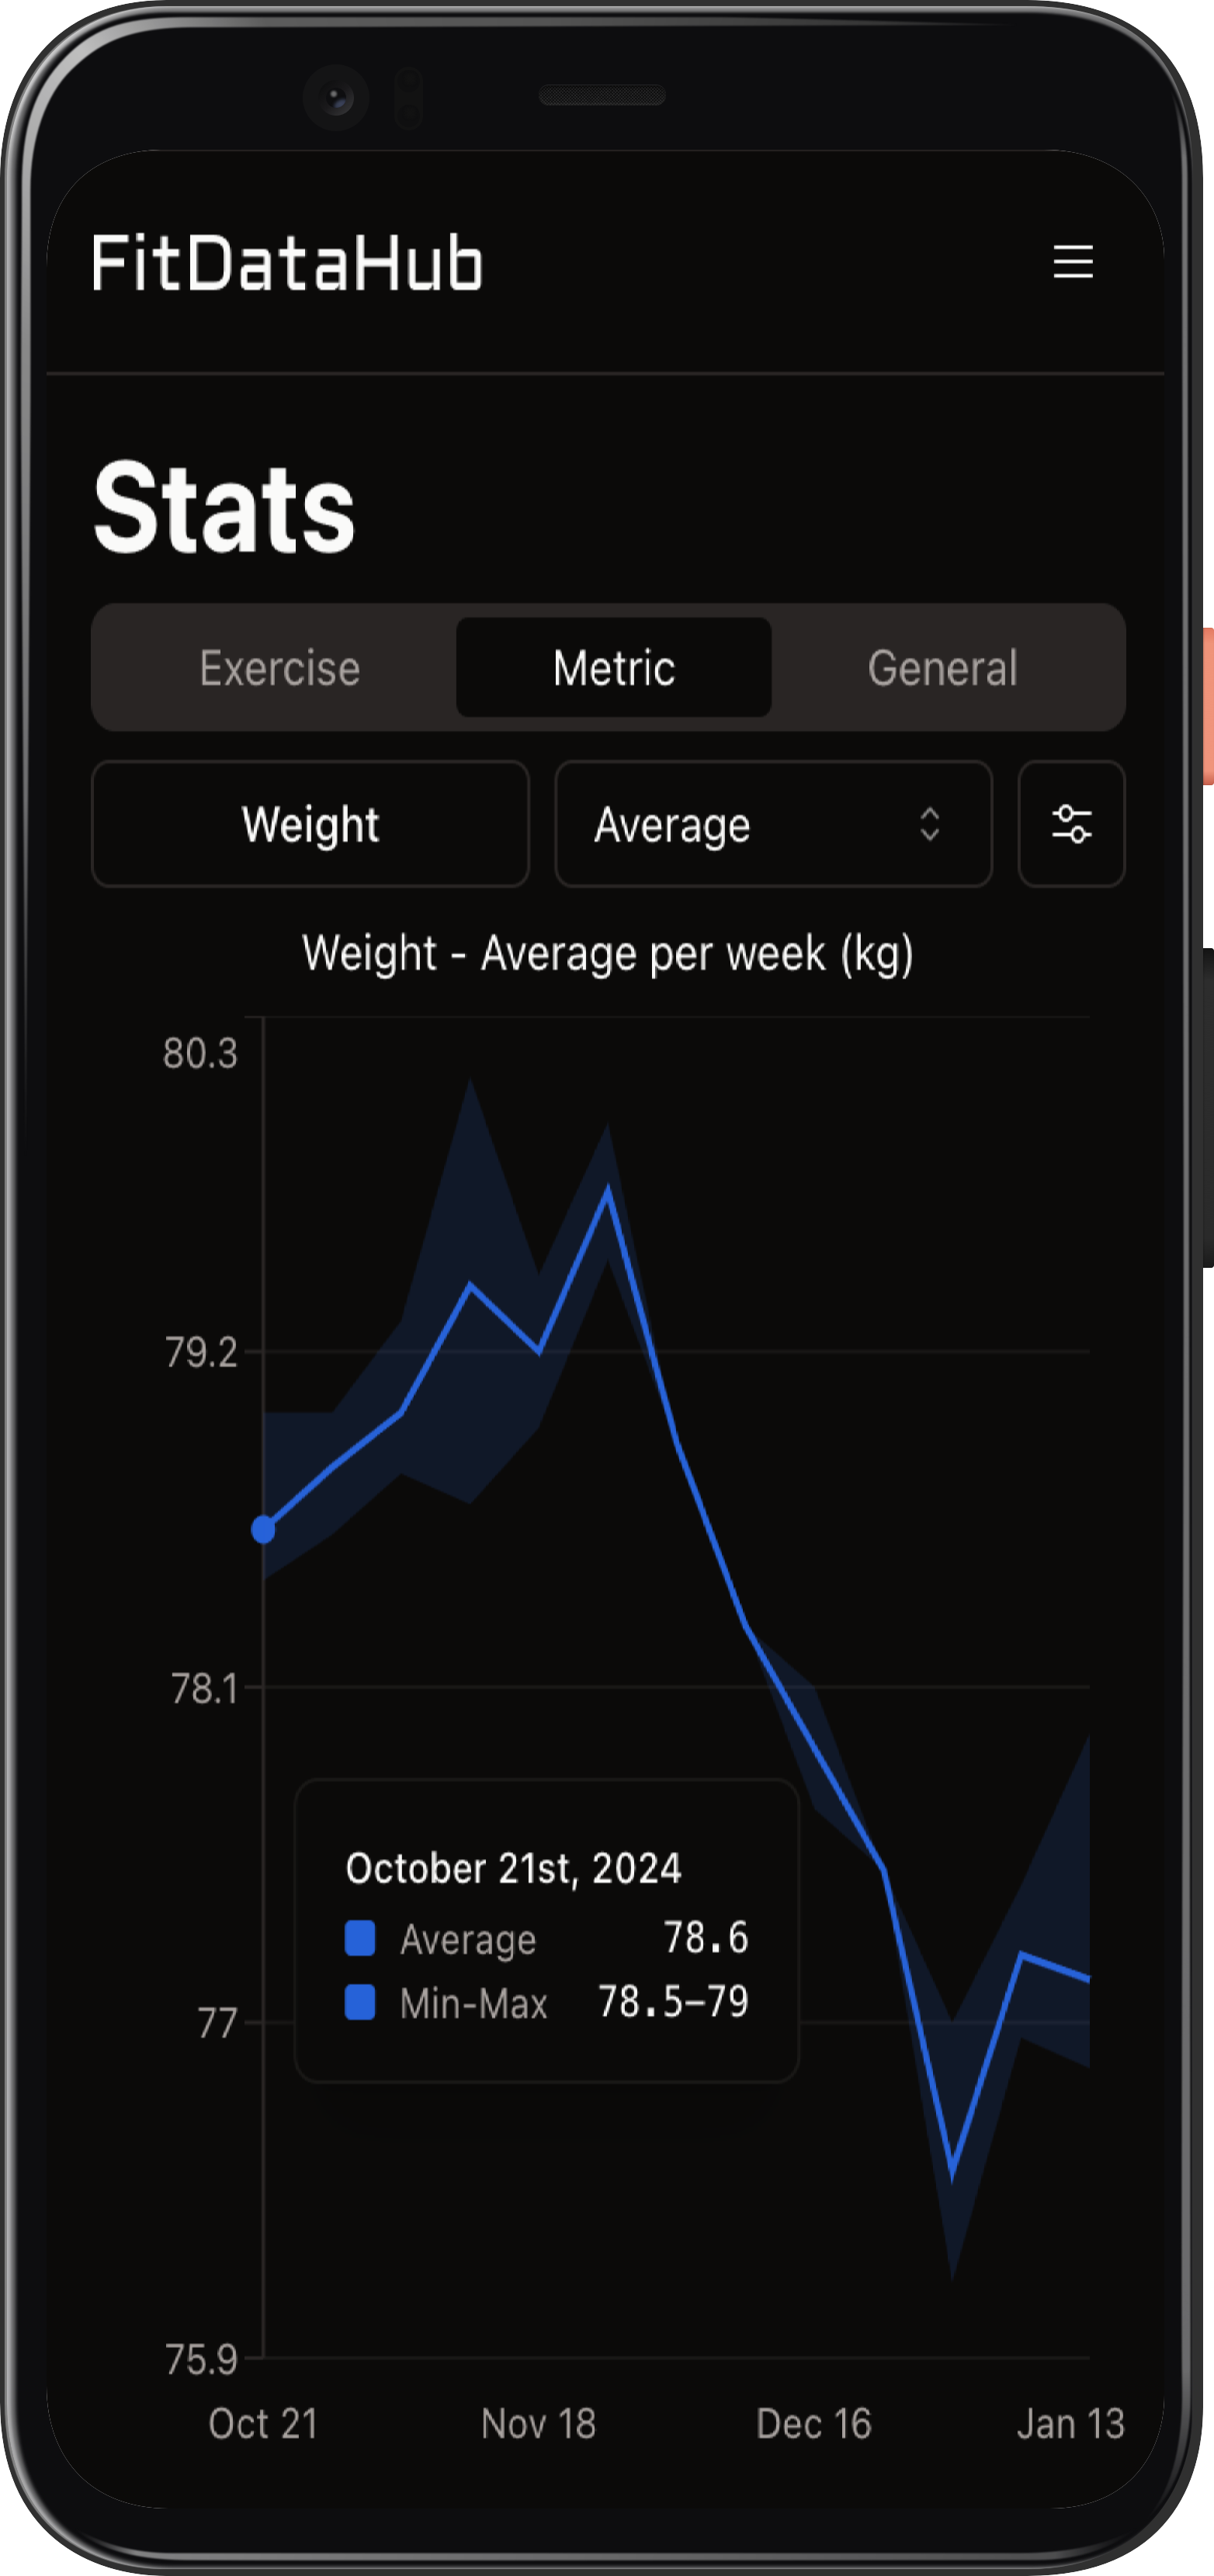
The Statistics page provides insights into your training data, helping you track progress and identify trends. At the top, there are three tabs for exploring different types of data: Exercises, Metrics, and General.

Exercise Statistics
Under the Exercises tab, you can select any exercise to analyze its data. Choose a specific statistic like reps, weight, or RPE. Certain statistics offer both average and total views. For example, you can see the average weight lifted for bench press on a given day or the total weight lifted in a session.
Metric Statistics
The Metrics tab allows you to analyze data from any tracked metric. After selecting a metric, you can view either the average or total values over time. For instance, you can track average steps per week or the total steps per week.
General Statistics
In the General tab, simply select a pre-defined graph to explore broader trends in your training.
Customizing Graphs

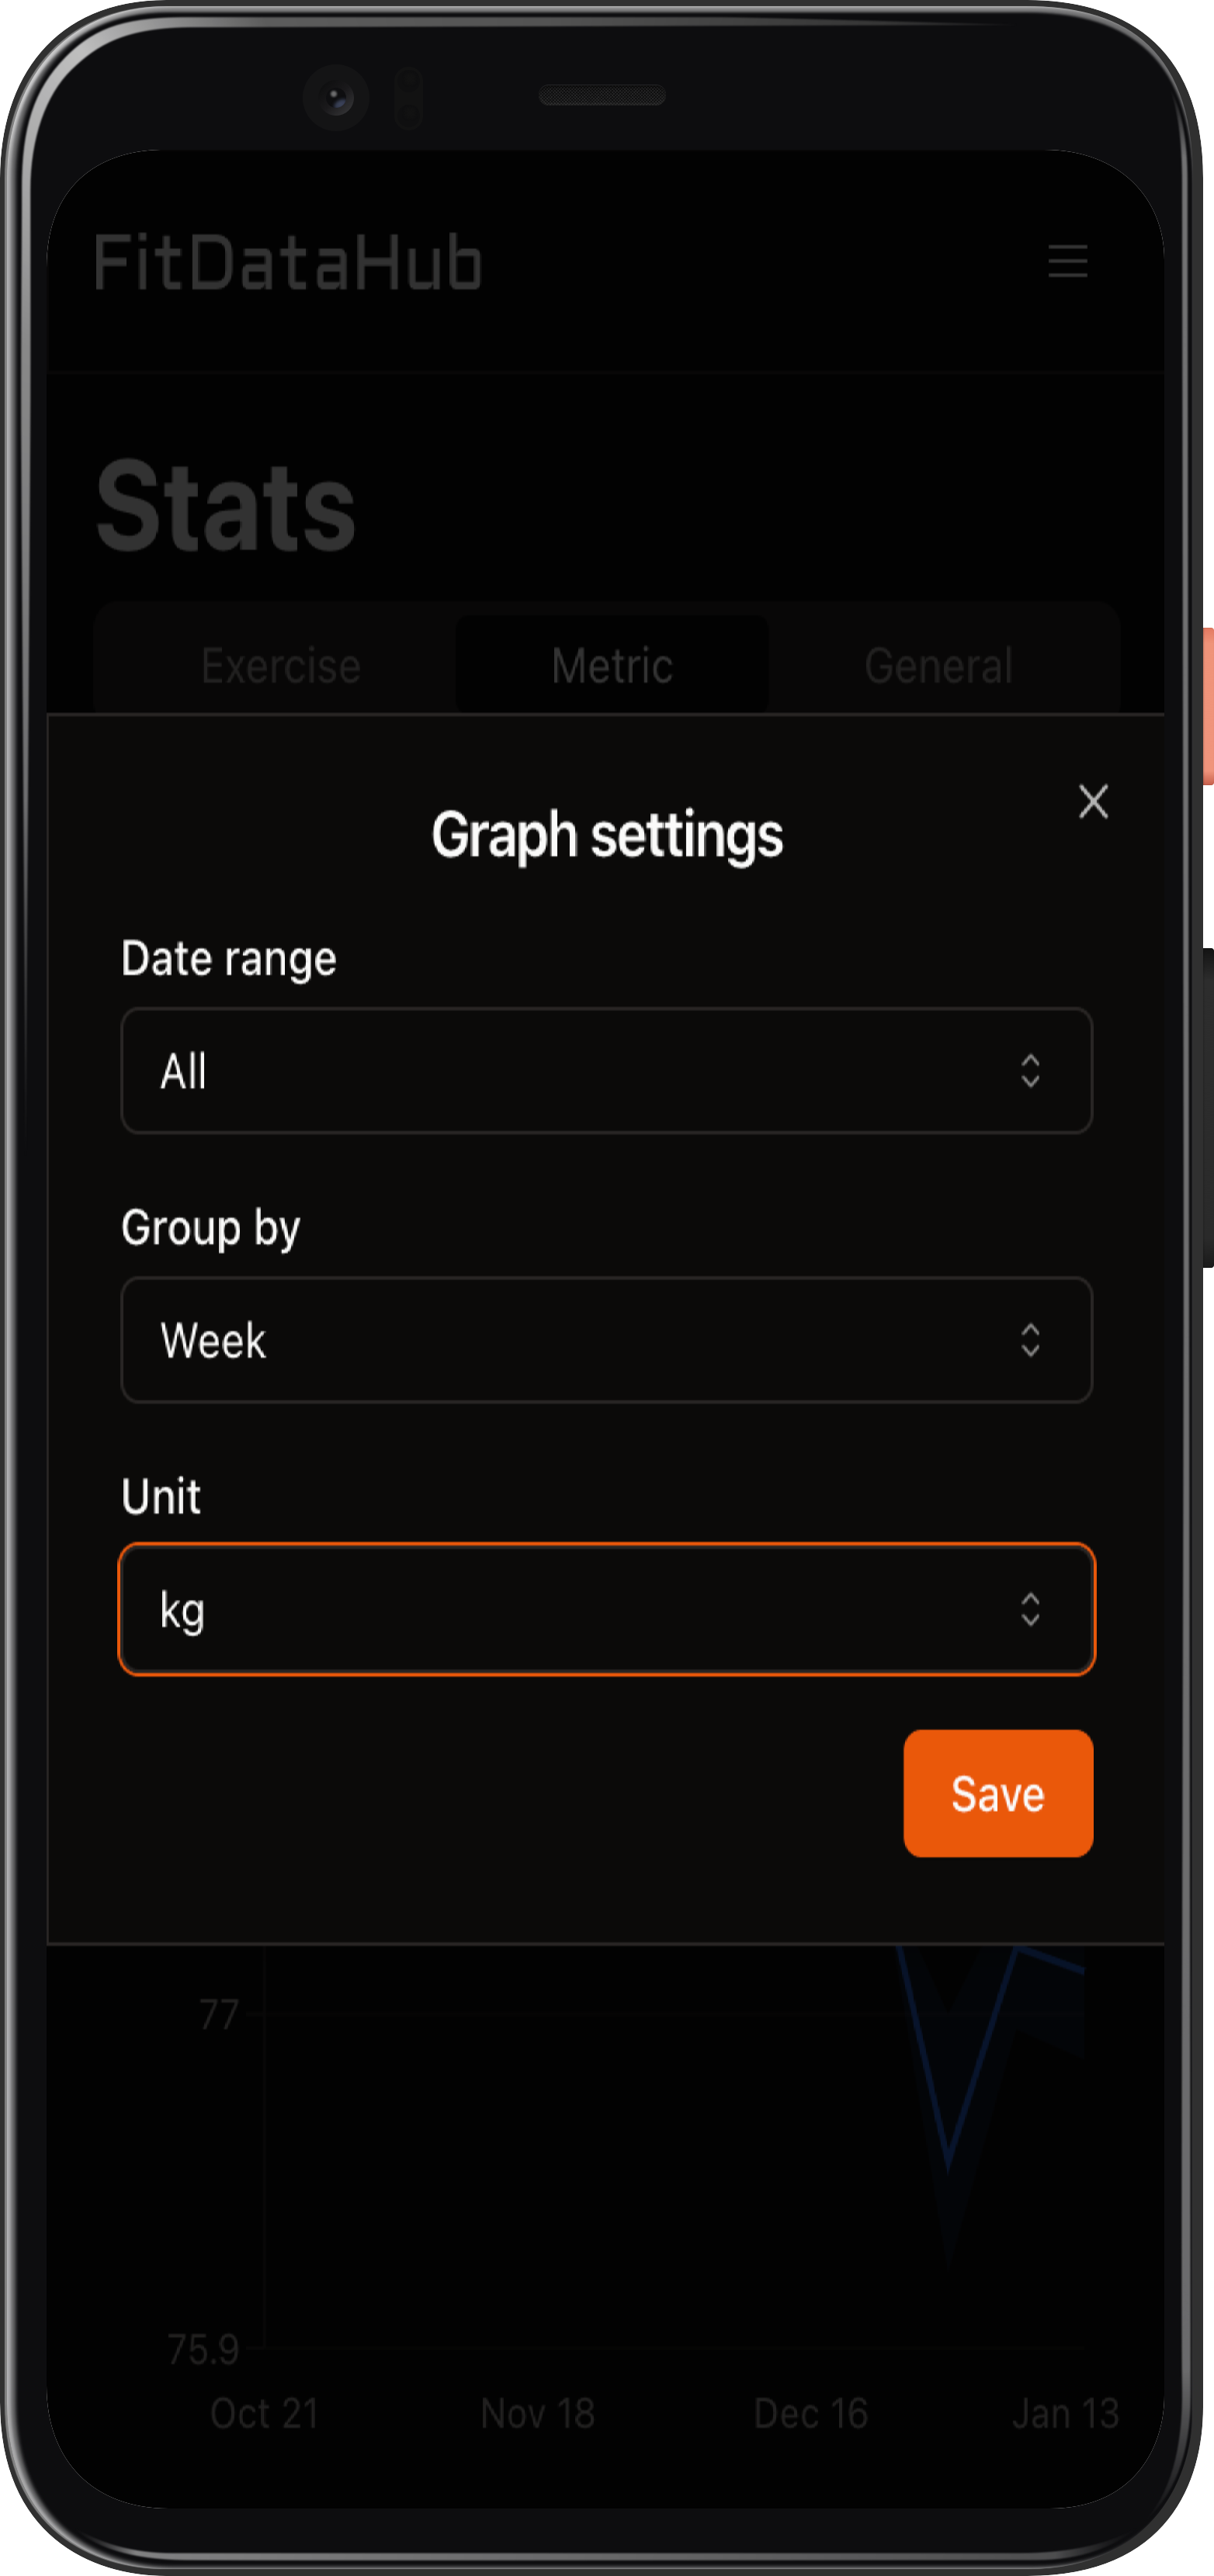
Each graph can be customized for deeper insights. Click the settings button on the right to open the customization modal, where you can adjust:
- Date Range: Choose between 1 month, 6 months, 1 year, or all time to define the period of analysis.
- Grouping: Select how data should be grouped—by day, week, or month. For grouped data, the graph displays the average as well as the range (min to max) of values.
- Units: Convert values when applicable (e.g., kg to lbs).
The Statistics page helps you visualize your progress and optimize your training strategy by providing detailed and customizable data analysis.